Lockdown fun – The Home Bandwidth Monitor
NetworkingThere’s never been a better time to catch up on all those household projects you’ve been putting off over the last X years. With lockdown firmly upon us in the UK, I decided to complete a project that’s been in the back of my mind ever since we subscribed to our third streaming service.
It’s clear that my broadband connection is starting to struggle. Given the sheer amount of computers, servers, phones, streaming boxes, and many other things with IP addresses (some of which I can’t even physically find, I’m going to have to resort to a full NAC solution soon!), I need some cold hard evidence to convince myself it’s worth looking at fibre.
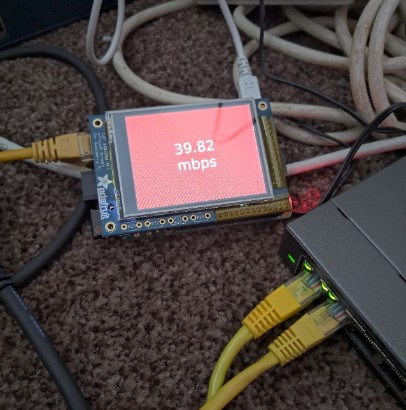
Enter the home-made throughput monitor, complete with colour coded output and trend statistics for determining just how often we’re hitting our piddly 40bmps threshold. Yes it’s massively over-engineered… but you know what they say; if it’s worth doing, it’s worth over-doing!
To start with, I dug out a Raspberry Pi from the drawer of mothballed units I have in the office. Once previously a Retro-Pi, Kodi or some SSH server laying around doing nothing other than inviting connections from Russia, I refreshed it with the latest Raspbian image and attached a screen to it.
I used the Adafruit PiTFT 2.8” screen as it’s low powered, has capacitive touch and works great for lightweight desktop environments such as XFCE. It’s also incredibly easy to install.
The Plan – Get throughput stats
Sure, my home router has lots of dashboards and stats for home Internet usage, but there’s a major limitation: it only reports in kilobytes per second (KBps), as opposed to megabits per second (mbps) which I’m more interested in.
Luckily, I have time on my hands.
The first step was to get decent throughput data for myself. This looks like a job for the Netgear GS108Ev3, an 8-gigabit port switch with one awesome little feature for its price range: port mirroring. For about £30, this switch gives you the ability to span other ports on the switch, and receive their traffic. It’s not as configurable as a full sized Cisco switch, but for the price range, it’s easily configurable and provides bi-directional traffic as well.
Once I physically placed this switched between my LAN and WAN router, I was now seeing all throughput traffic out to the net.
I started with the simplest approach, which was to awk the file /proc/net/dev on the Raspberry, with it’s eth0 interface receiving the span traffic in promiscuous mode. It’s not 100% accurate, but by awking the file every second, and subtracting the differences, I could easily get the bytes per second count going to\from my ISP.
cat /proc/net/dev | awk 'FNR == 3 {print $2}' > byte_count
One-liner for bash script to pull the bytes received into my promiscuous mode interface.
Bytes per Second into mbps
Now I have the bytes per second, I want to put it into something more meaningful. This is a simple calculation, which takes the bytes per-second and divides by 125,000 (the amount of bytes per second in a Mbit). Wikipedia really came in handy here.
So just like that, you can figure out your own true Mbps cost of streaming all that Disney and Netflix crap. However, reading the output of a Bash script on a 320 x 280 screen is no fun at all. I want it to look good! So I started looking for ways to display the result.
ncurses?
Displaying the contents of the mbps value and a looping interval was the way to go, and for version one – I only need the one value (I want to add top talkers, destinations etc later on!). But if you’re not familiar with text based terminals such as Bash, they aren’t exactly geared up for fancy front-end development. I decided to abandon the ncurses approach very quickly.
At this point, it was obvious I needed a web GUI front-end to display all the stats I’m interested in, using a familiar language (HTML) and well-known web libraries. All that was needed was to save the output of the file in a loop to a HTML file, and have Firefox refresh the page.
But that’s too easy. Let’s make it a little more complex shall we?
If it’s worth doing, it’s worth over-doing

I decided that this would be a great job for Python. I can have the script pull the same network statistics using the ubiquitous psutil module, and output a HTML file for Firefox to pick up. I could also add a history file to the program, which includes previous stats alongside timestamps to start building trend data.
The final result was a little silly, but hey, it works:
	raw_network_stats_start = psutil.net_io_counters(pernic=True)
	received_start = raw_network_stats_start['eth0'].bytes_recv
	time.sleep(1)
	raw_network_stats_end = psutil.net_io_counters(pernic=True)
	received_end = raw_network_stats_end['eth0'].bytes_recv

	bytes_per_second = received_end - received_start
	mbps = decimal.Decimal(bytes_per_second / 125000)
	print('{:.2f}'.format(mbps) + "mbps" )
	return mbps
Eventually I want to add statistics showing the most busy times of day (likely when my daughter gets home and destroys Netflix), or top talkers and destinations. I’d love to hear from my regulars regarding any home-networking related projects they’ve taken on.